Data Analytics in the Covid-19 Trenches
How Washington State’s Pandemic Insights Got a Jump-Start.
This article on Covid-19 Data Analytics was written by Douglas Textor with Susan Pessemier.

Good, fast decisions require good information, and when the pandemic struck, the data in Washington State was in too many inaccessible places. Remarkably, the state’s initial decisions, based on incomplete information, were very good. But with the Covid-19 virus’s virility, the decision requirements still remain after many months and the high stakes change daily, if not hourly. How did the information required to manage the pandemic appear on short notice? First you need to gather the data.
If you are in the business of data analytics, or converting data to information, you knew right away when the pandemic started, there would be severe information problems. Add one plus two. 1) Officials need information on how the virus was moving. 2) That information is in too many different places.
More Questions than Answers
Consider questions such as: Where is emergency response data? Or another question, who knows the rate of hospital admissions at private hospitals? In addition, where is nursing home data? Is there really a morgue or just a bunch of private mortuaries? On and on, the questions fly at leaders and the answers are not readily available.
Importantly, since the pandemic started, new questions arise each day. In the business of creating knowledge from data, fresh answers lead to the next questions. What is the availability status of PPE (personal protective equipment) for front line health workers. What about folks who died at home and were never tested? Where are the hot spots today and where will they be tomorrow?
You can find answers to some of the questions with some digging, research, and a lot of phone calls. However, can you get the answers updated with accuracy four times a day, satisfying the equivalent of war time decision making?
Of course, OmniData™ and TimeXtender often solve these types of problems. We see each instance as ungoverned data from a lot of sources and our job is to structure all of that data in a useable way. We structure the data to provide knowledge, so leaders can make good decisions. The knowledge and information are best displayed in maps and data visualizations, once the data is gathered and structured. Notably, we rarely see the need for speed that we have seen here.
TimeXtender Became a Catalyst for Covid-19 Data Analytics
Susan Pessemier of TimeXtender happens to be OmniData™’s partner manager. It is through her efforts that I have had a front row seat to the developments in Washington State that have led, in record time, to State Governor Jay Inslee getting daily reports and to the State Department of Health providing the following interactive dashboard on their web site.

Here is how this came to be in early March, 2020. Susan’s husband has many years in Emergency and Disaster Management and saw how TimeXtender’s technology could improve the data and information flow required to respond during a disaster. TimeXtender leadership agreed to offer their assistance in the form of free software and services to help.
Quickly, a council was formed. The HealthTech Community Response Council included Microsoft, TimeXtender, and the Washington Technology Industry Association. The purpose of the Council was to voluntarily serve the needs of the state, municipalities and public health organizations. Key leaders from the state agencies were eager to attend the initial forum, share their needs and concerns about what data they needed, and from whom. In the opening minutes of the first forum meeting, they shared their lack of ability to stand up new solutions without outside help. The DOH exists for public health, not reporting data. The pandemic is far larger than any single entity and requires coordination of many entities, along with cooperation from the public. Needless to say, the public is more cooperative when they get clarity on circumstances. Clarity comes from simple, relatable, powerful measures, charts and graphs.

Offers of Help – Difficulty Consuming the Help
From the start, there was an overwhelming response and offerings of help from the HealthTech Community Response Council for Washington’s health providers. At first, no one could really explain exactly what they needed, or how they would get the data, reflecting the mysterious nature of the virus itself. Because of the urgency at hand, the agencies weren’t shy to express their confusion on how they could consume all of the offers of help. Again, health agencies and hospitals are staffed for health-related activities and NOT for information technology.
That was the crux of the matter, isolating the needs, organizing the offers of help and the resources available. It quickly became clear, this was going to have to happen with collective leadership and individuals working outside their comfort zones and beyond their normal jobs.
Speed and Results
Clarity on a few things here:
1). One month ago, no one could have built the dashboards displayed on the DOH website. The data was in too many different places, controlled by too many different people.
2). No one individual or entity can take credit for the creation of the dashboards. For instance, Microsoft has offered extensive infrastructure resources, development services, and guidance. TimeXtender has participated in the organization and planning. Going forward, it’s my opinion that TimeXtender’s products will emerge as the best available to formalize and automate the data collection, governance and architecture. Washington DOH has, naturally participated in the organization and governance.
3). On the ground, each hospital has suddenly risen to the task of providing the data. The pandemic forced staff to suddenly start collecting this data. The information may never have been reported this way, until now. Going forward, data reporting is going to become a requirement in places it was not only a short time ago.
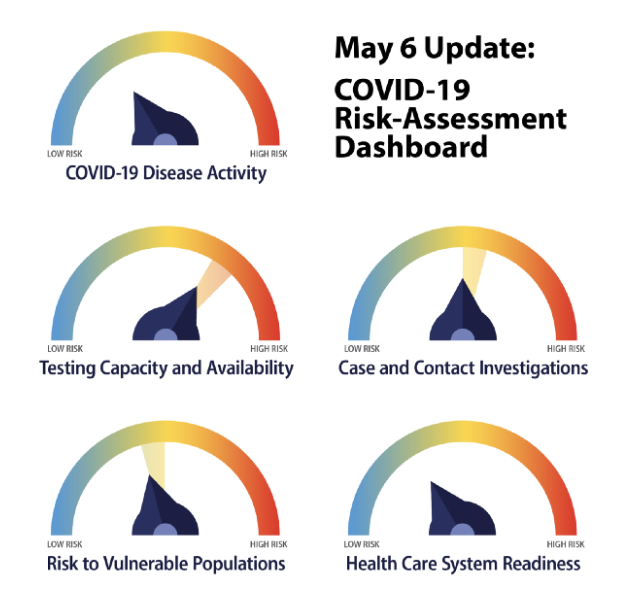
From Prototype to Production Ready
The result, from the link above and in the graphic provided on the article, is a powerful example of what Microsoft’s Power BI platform can produce in a short period of time. However, the result functions as a prototype, meaning that sometimes it breaks and sometimes the data is not completely up to date. For full reliability, speed of updating, and expansion of capability, a new set of skills and tools will need to be applied to the problem. Those skills and tools are available from The HealthTech Community Response Council members. Unfortunately, the health agencies and hospitals have stretched past their abilities to grow in the information technology business. They are busy saving lives.
By any measure, the results for Washington’s Covid-19 data analytics since that first meeting in March get high grades depending on who you are asking. Perfectionists and lay people might say, “So what? Just do it. Just make the computer do it.” However, folks with experience in data analytics technology development will see this another way. If you study leadership and team building around information projects, the results are impressive. The team deserves to be commended.
The Washington State DOH dashboard only scratches the surface of the information that can be valuable to manage the pandemic. Once the pandemic subsides, other day to day health policy and government support requirements will emerge. We’ll continue to report here on what comes next.
Rapid Prototyping is here to stay – Data Automation must follow
The result was produced while the team formed. Folks with a variety of skills climbed steep learning curves to understand the goals. Many participated well beyond the time they had available and outside their skill comfort zones. If you are a veteran of information technology, data analytics and digital transformation, some of you may be cringing, because, OMG a million things can go wrong from here. By the way, the website crashed a couple of times while I was writing this today. The data when I last checked was 36 hours old.
Others, like myself, that love to see speed in innovation, are cheering. This may never have happened without the gravity of a pandemic. Primarily, state and private entities don’t have the knowledge, skillsets, or time to innovate past their primary objectives. However, the right information technology tools and the will of a team can accomplish great things.
What Needs to Happen Now for Washington’s Covid-19 Data Analytics?
New questions emerge daily. The rapidity of the Covid-19 data analytics solution turnaround means it may be frail. Staffing to provide on-going data may be too stretched. Leaders will need to understand that frailty and find a way to bring resources to make information flow more dependable. Our follow-up article, Part 2, will outline in detail next steps toward reliability, growth and sustainability of this fine Data Architecture and Data Analytics effort.
Notes: Neither OmniData™, nor TimeXtender are attempting to take credit for the effort described in this article. Thus far, OmniData™ has only witnessed from the sidelines. This article celebrates rapid prototyping in a crisis. And, of course, it shows the value of Data Analytics in difficult decision-making.
About OmniData™
OmniData™ provides products and services at every phase of the data lifecycle. When you need us, we are passionate about your success. We mine your hidden data assets and we will accelerate your time to data insights 10X.


CEO
Doug has worked with emerging technologies, promoting digital transformation his entire career. In the eighties, Doug was a leader in real time, fault tolerant technologies, creating the first brokerage and analytics systems powering Wall Street. For two decades starting in the nineties, his digital agency The Cannery defined and dominated interactive technologies from the web to DVD and Blu Ray. Then in 2010, Doug came back to analytics and IT, founding Crunch Data, followed by OmniData™. “We help our clients mine their valuable data stores.”