Overview:
The OmniData™: Dynamics AX Inventory Analytics - Power BI Model, is designed to unlock key inventory metrics like inventory days, inventory turn and monthly usage from transactional inventory data and present it in a set of easy to use and easy to understand dashboard that can easily be enhanced to meet specific needs.

Navigation:
OmniData™ Insights: Dynamics Inventory Analytics Dashboard
The dashboard provides an initial view of several inventory metrics. Clicking on any of the dashboard tiles will take you to the underlaying report from which you can further slice and dice the data.
Inventory Value Analysis
This report is designed to give you an overview of inventory value by company.
- Filters:
- Company ID + Name
- Product Group Name
- Calendar Year & Month
- Report Components:
- Inventory Value
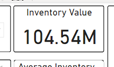
- This is the most recent “Inventory Closing Value”
- Average Inventory Value:
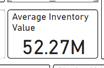
- This is the most recent “Average Inventory Value”
- Inventory Value History
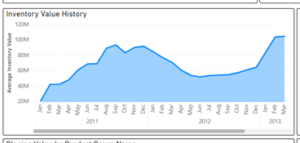
- This is a historical area chart indicating the “Average Inventory Value” on a monthly timeline.
- Closing Value & Inventory Turn
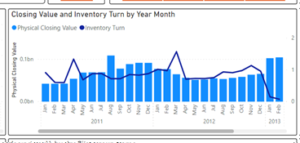
- This is the historical “Inventory Closing Value” represented as a column chart and the “Inventory Turn” represented as a line chart on a separate axis.
- Inventory Value

-
- Closing Value by Product Group Name
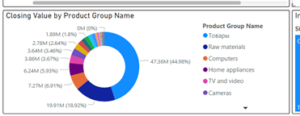
- This is the “Inventory Closing Value” per Product Group
- Inventory Value by Site

- This is the Inventory Value by Site
- Closing Value by Product Group Name
Inventory Value Detail
This report is designed to provide detailed analytics of inventory value by company.
- Filters:
- Company ID + Name
- Product Group Name
- Calendar Year & Month
- Report Components:
- Inventory Value
- This is the most recent “Inventory Closing Value”
- Average Inventory Value:
- This is the most recent “Average Inventory Value”
- Average inventory is the median value of inventory within a period.
- Physical Closing Value by Product Group Name (top 15)

- This is a funnel chart of the Physical Closing Value by product group.
- ItemID + Name Table

- This table shows the “Inventory Turn”, “Day in Inventory” and “COGS” per item.
- COGS is the direct expense associated with providing a service or producing a product calculated as: Beginning Inventory + Purchases – Ending Inventory = COGS
- Inventory Turn is the ratio of how many times a business sells and replaces its inventory in a given period. Calculated as: COGS/Average Inventory
- Days in Inventory is the total number of days a company takes to sell its average inventory. Calculated as: Number of days in the period by the inventory turnover ratio.
- Inventory Value

Inventory Quantity Analysis
This report is designed to give you an overview of inventory quantity by company.
- Filters:
- Company ID + Name
- Product Group Name
- Calendar Year & Month
- Report Components:
- Inventory Quantity
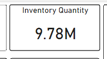
- This is the most recent “Inventory Closing Quantity”
- Days in Inventory
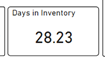
- This is the “Days in Inventory”
- Inventory Quantity History
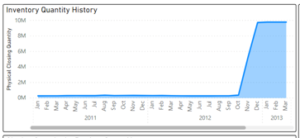
- This is the physical closing quantity represented over time.
- Closing Quantity by Product Group
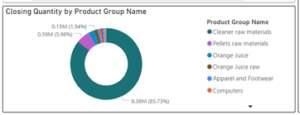
- This is the most recent Physical Closing Quantity by Product Group.
- Inventory Quantity

-
- Inventory Quantity by Site
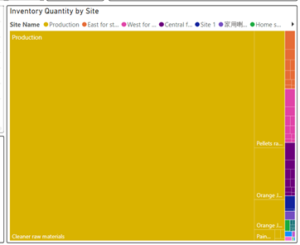
- This shows the most recent Physical Closing Quantity by Site.
- Inventory Quantity by Site
Inventory Quantity by Site
This report is designed to give you an overview of inventory quantity by site.
- Filters:
- Company ID + Name
- Product Group Name
- Calendar Year & Month
- Location ID & Name
- Report Components:
- Inventory Quantity
- This is the most recent “Inventory Closing Quantity”
- Physical Closing Quantity by Site ID + Name

- The most recent “Physical Closing Quantity” by Site ID and Name.
- Closing Quantity by Site Table
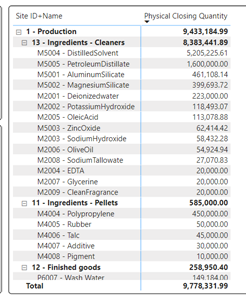
- This table shows you the “Physical Closing Quantity” by Site for each Item ID + Name.
- Inventory Quantity

Inventory Planning
This report is designed to provide you with relevant inventory metrics used during the procurement planning process.
- Filters:
- Company ID + Name
- Product Group Name
- Calendar Year & Month
- Item ID & Name
- Report Components:
- Inventory Quantity
- This is the most recent “Inventory Closing Quantity”
- Days In Inventory
- This is the “Days in Inventory”
- Months In Inventory

- This is the "Months in Inventory"
- Inventory Turn
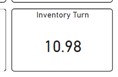
- Inventory Turn is the ratio of how many times a business sells and replaces its inventory in a given period. Calculated as: COGS/Average Inventory
- Average Monthly Usage
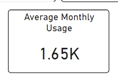
- The Average Monthly Usage
- Physical Closing Quantity by Year and Month
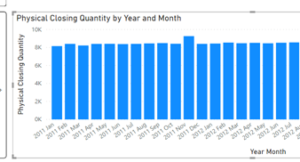
- The most recent “Physical Closing Quantity” by Year and Month
- Inventory Quantity

Inventory ABC Analysis
This report is designed to provide you with A simple inventory ABC analysis.
- Filters:
- Company ID + Name
- Product Group Name
- Calendar Year & Month
- Item ID & Name
- ABC Item
- Report Components:
- Value by ABC

- ABC Analysis is calculated as:
- A <= 70% of Item Total
- B <= 90% of Item Total
- C > 90% of Item Total
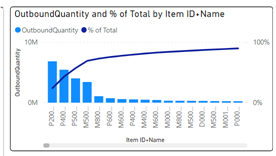
- Outbound Quantity and % of Total by Item + Name
- Item ID + Name by ABC Item

- Items classified as A, B and C
- Value by ABC